Plot UMIs per UPIa for quality control
TauPlot.RdPlot UMIs per UPIa for quality control
Usage
TauPlot(object, ...)

# S3 method for class 'data.frame'
TauPlot(object, group_by = NULL, ...)

# S3 method for class 'Seurat'
TauPlot(object, group_by = NULL, ...)See also
Other QC-plots:
CellCountPlot()
Examples
library(pixelatorR)
# Load example data as a Seurat object
pxl_file <- minimal_mpx_pxl_file()
seur_obj <- ReadMPX_Seurat(pxl_file)
#> ✔ Created a 'Seurat' object with 5 cells and 80 targeted surface proteins
seur_obj
#> An object of class Seurat
#> 80 features across 5 samples within 1 assay
#> Active assay: mpxCells (80 features, 80 variable features)
#> 1 layer present: counts
# Plot with data.frame
TauPlot(seur_obj[[]])
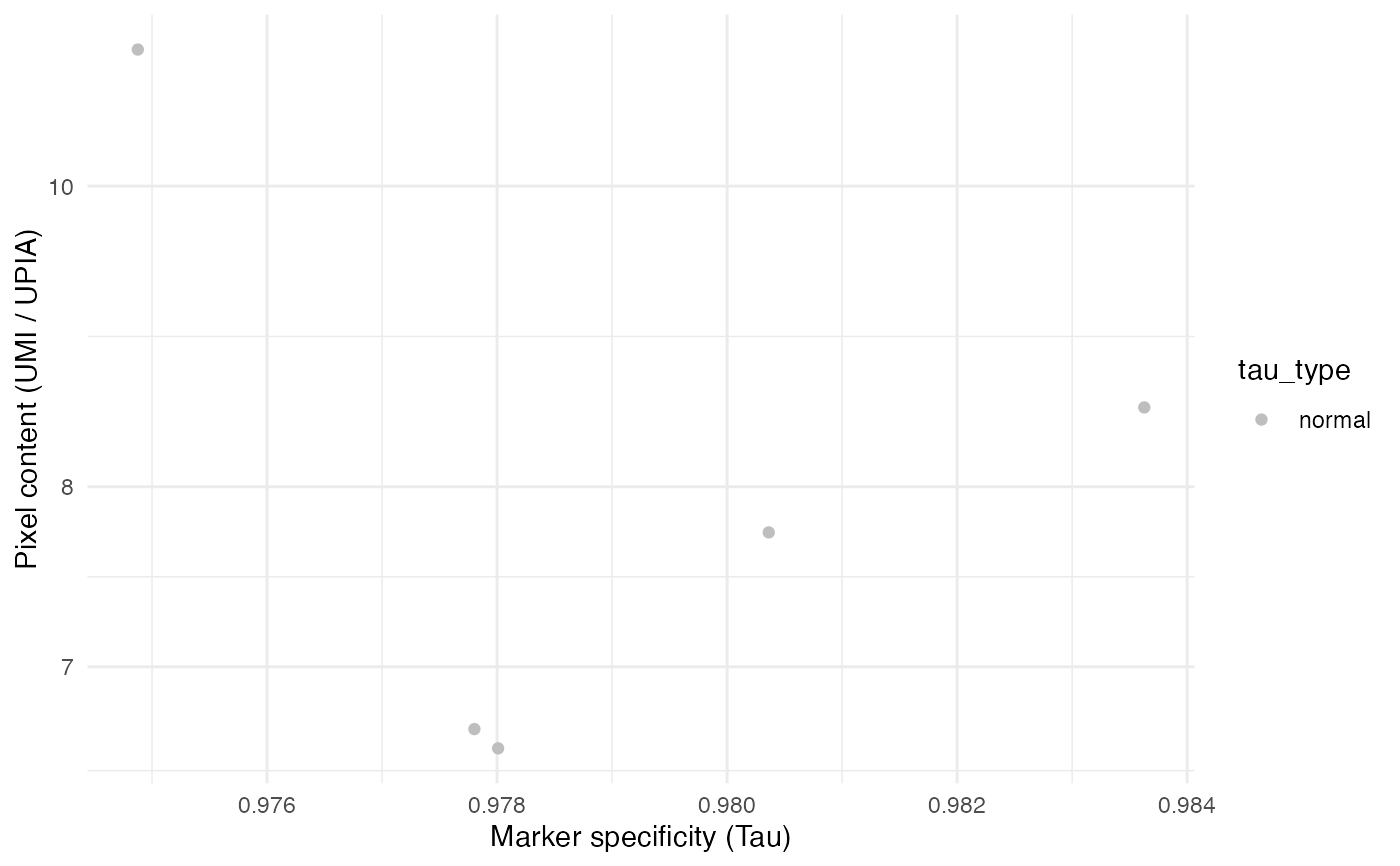 # Plot with Seurat object
TauPlot(seur_obj)
# Plot with Seurat object
TauPlot(seur_obj)
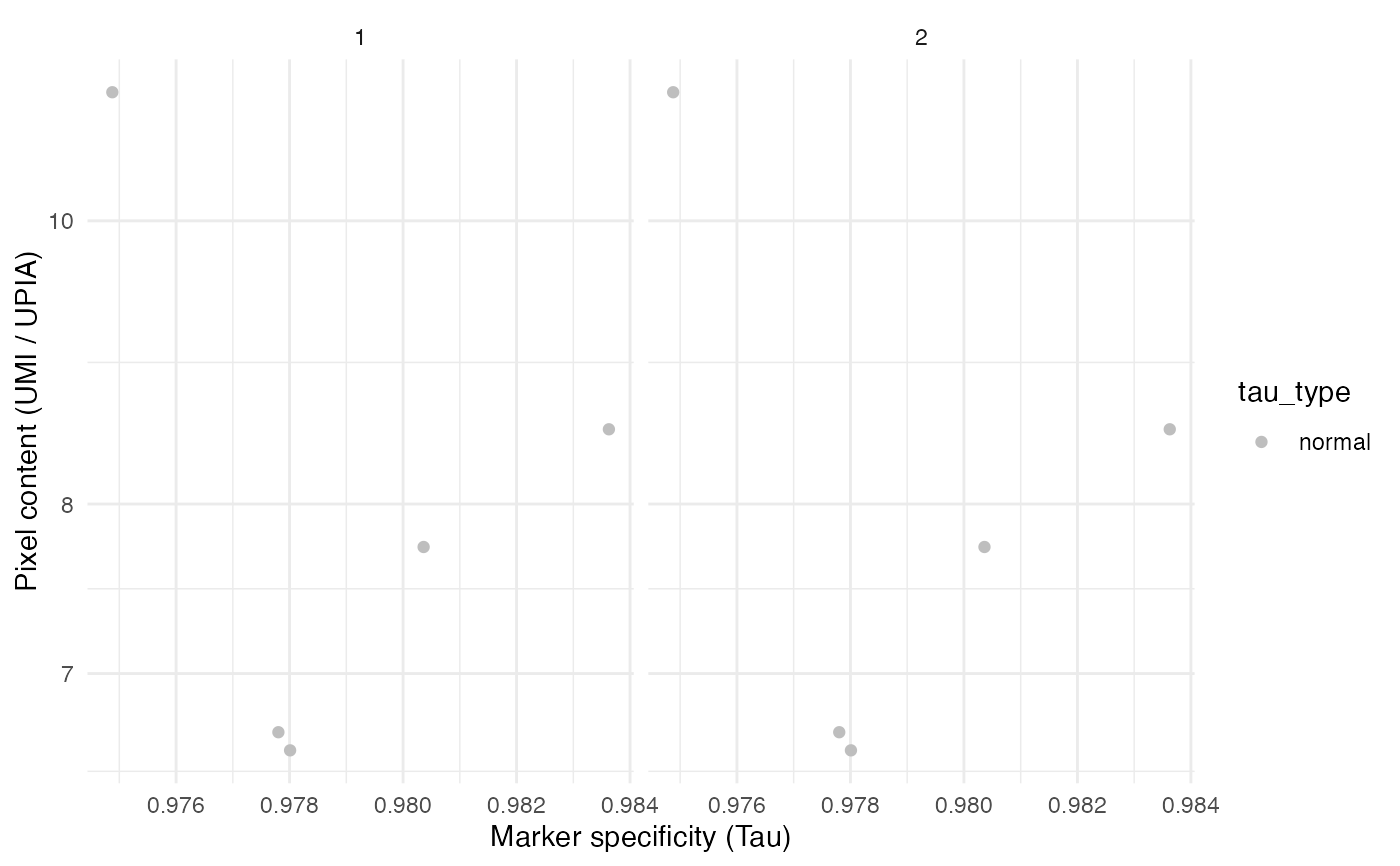
 # Group by sample in merged data
seur_obj1 <- seur_obj2 <- seur_obj
seur_obj1$sample <- "1"
seur_obj2$sample <- "2"
seur_obj_merged <- merge(seur_obj1, seur_obj2, add.cell.ids = c("A", "B"))
TauPlot(seur_obj_merged, group_by = "sample")
# Group by sample in merged data
seur_obj1 <- seur_obj2 <- seur_obj
seur_obj1$sample <- "1"
seur_obj2$sample <- "2"
seur_obj_merged <- merge(seur_obj1, seur_obj2, add.cell.ids = c("A", "B"))
TauPlot(seur_obj_merged, group_by = "sample")