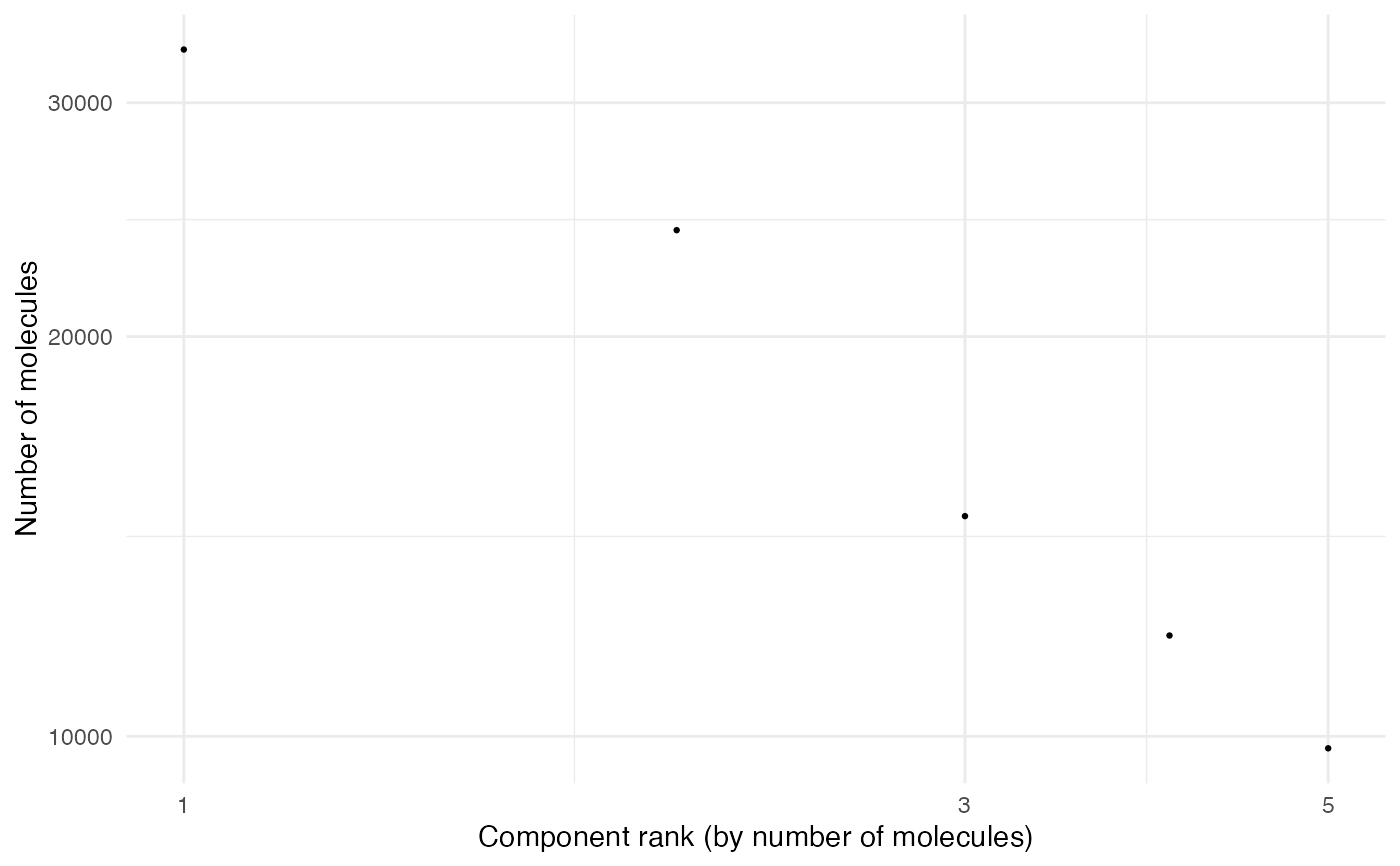
Edge Rank Plot
EdgeRankPlot.Rd![[Deprecated]](figures/lifecycle-deprecated.svg)
The function has been replaced by MoleculeRankPlot and
will be removed in a future release.
Arguments
- object
A Seurat object
- group_by
A character specifying a column to group by
- ...
Additional arguments to pass to
MoleculeRankPlot
Examples
library(pixelatorR)

# Load example data as a Seurat object
pxl_file <- minimal_mpx_pxl_file()
seur_obj <- ReadMPX_Seurat(pxl_file)
#> ✔ Created a 'Seurat' object with 5 cells and 80 targeted surface proteins
seur_obj
#> An object of class Seurat
#> 80 features across 5 samples within 1 assay
#> Active assay: mpxCells (80 features, 80 variable features)
#>  1 layer present: counts

EdgeRankPlot(seur_obj)