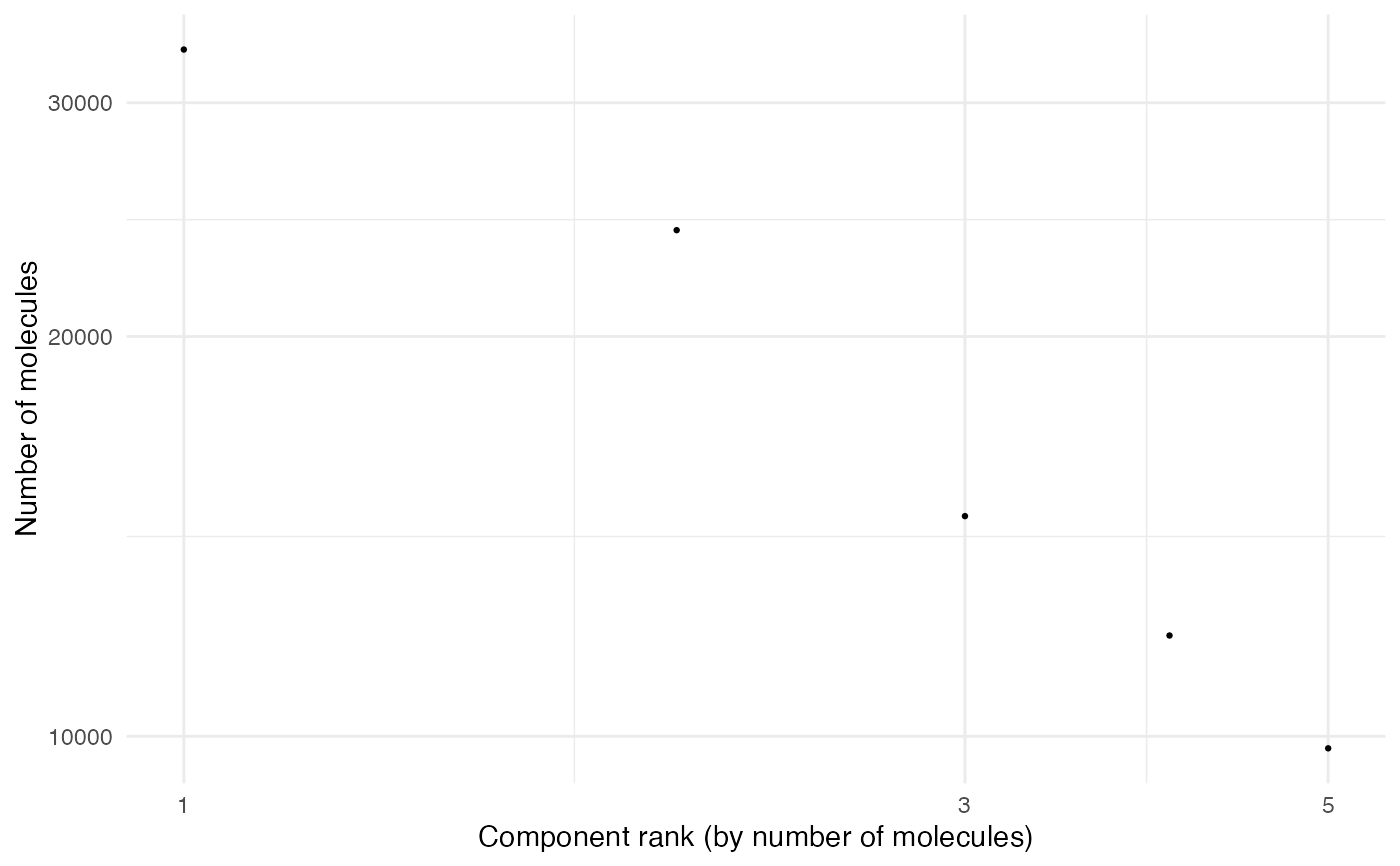
Molecule Rank Plot
MoleculeRankPlot.RdPlots the number of molecules per component against the molecule rank (descending order).
Usage
MoleculeRankPlot(object, ...)

# S3 method for class 'data.frame'
MoleculeRankPlot(
  object,
  group_by = NULL,
  n_umi_min_threshold = NULL,
  n_umi_max_threshold = NULL,
  highlight_cell_counts = TRUE,
  rug = FALSE,
  split = FALSE,
  ...
)

# S3 method for class 'Seurat'
MoleculeRankPlot(
  object,
  group_by = NULL,
  n_umi_min_threshold = NULL,
  n_umi_max_threshold = NULL,
  highlight_cell_counts = TRUE,
  rug = FALSE,
  split = FALSE,
  ...
)
Arguments
- object
A
data.frame-like object or aSeuratobject- ...
Parameters passed to other methods
- group_by
A character specifying a column to group by. By default, the groups are assigned a unique color. If
split = TRUE, the points are not colored.- n_umi_min_threshold, n_umi_max_threshold
Minimum/maximum number of UMIs to define a component as "Normal". If provided, the components will be grouped into categories "Low", "Normal" and "High" based on the number of UMIs and the provided thresholds.
- highlight_cell_counts
Whether to highlight cell counts for categories "Low", "Normal" and "High".
- rug
Whether to add a rug plot on the left side of the plot to highlight the component density.
- split
Whether to split the plot by
group_byinto facets.
Examples
library(pixelatorR)

# Load example data as a Seurat object
pxl_file_pna <- minimal_pna_pxl_file()

seur_obj_pna <- ReadPNA_Seurat(pxl_file_pna)
#> ✔ Created a <Seurat> object with 5 cells and 158 targeted surface proteins
seur_obj_pna
#> An object of class Seurat
#> 158 features across 5 samples within 1 assay
#> Active assay: PNA (158 features, 158 variable features)
#>  2 layers present: counts, data

# Plot with data.frame
MoleculeRankPlot(seur_obj_pna[[]])


library(pixelatorR)

# Plot with Seurat object
MoleculeRankPlot(seur_obj_pna)
library(pixelatorR)
# Plot with Seurat object
MoleculeRankPlot(seur_obj_pna)