Plot multiple markers on multiple graphs
Plot2DGraphM.RdIn contrast to Plot2DGraph, which only draw 1 marker at the time,
this function makes it possible to arrange plots into a grid with markers in rows
and components in columns. The color scales are fixed for each marker so that their
limits are the same across all components.
Usage
Plot2DGraphM(
  object,
  cells,
  markers,
  assay = NULL,
  layout_method = c("cpmds_3d", "wpmds_3d", "pmds_3d", "cpmds", "wpmds", "pmds"),
  colors = c("lightgrey", "mistyrose", "red", "darkred"),
  map_nodes = TRUE,
  map_edges = FALSE,
  log_scale = TRUE,
  node_size = 0.5,
  edge_width = 0.3,
  show_Bnodes = TRUE,
  titles = NULL,
  titles_theme = NULL,
  titles_size = 10,
  titles_col = "black",
  ...
)
Arguments
- object
A
Seuratobject- cells
A character vector with cell IDs
- markers
A character vector with marker names
- assay
Name of assay to pull data from
- layout_method
Select appropriate layout previously computed with
ComputeLayout- colors
A character vector of colors to color marker counts by
- map_nodes, map_edges
Should nodes and/or edges be mapped? Note that component graphs can have >100k edges which can be very slow to draw.
- log_scale
Convert node counts to log-scale with
log1p. This parameter is ignored for PNA graphs.- node_size
Size of nodes
- edge_width
Set the width of the edges if
map_edges = TRUE- show_Bnodes
Should B nodes be included in the visualization? This option is only applicable to bipartite MPX graphs. Note that by removing the B nodes, all edges are removed from the graph and hence,
map_edgeswill have no effect.- titles
A named character vector with optional titles. The names of
titlesshould matchcells- titles_theme
A
themeused to style the titles- titles_size
The size of the text in the plot titles
- titles_col
The color of the plot titles
- ...
Parameters passed to Plot2DGraph
Examples
library(pixelatorR)
# MPX
pxl_file <- minimal_mpx_pxl_file()
seur <- ReadMPX_Seurat(pxl_file)
#> ✔ Created a 'Seurat' object with 5 cells and 80 targeted surface proteins
seur <- LoadCellGraphs(seur, load_as = "Anode")
#> → Loading CellGraphs for 5 cells from sample 1
#> ✔ Successfully loaded 5 CellGraph object(s).
seur <- ComputeLayout(seur, layout_method = "cpmds", dim = 2)
#> ℹ Computing layouts for 5 graphs
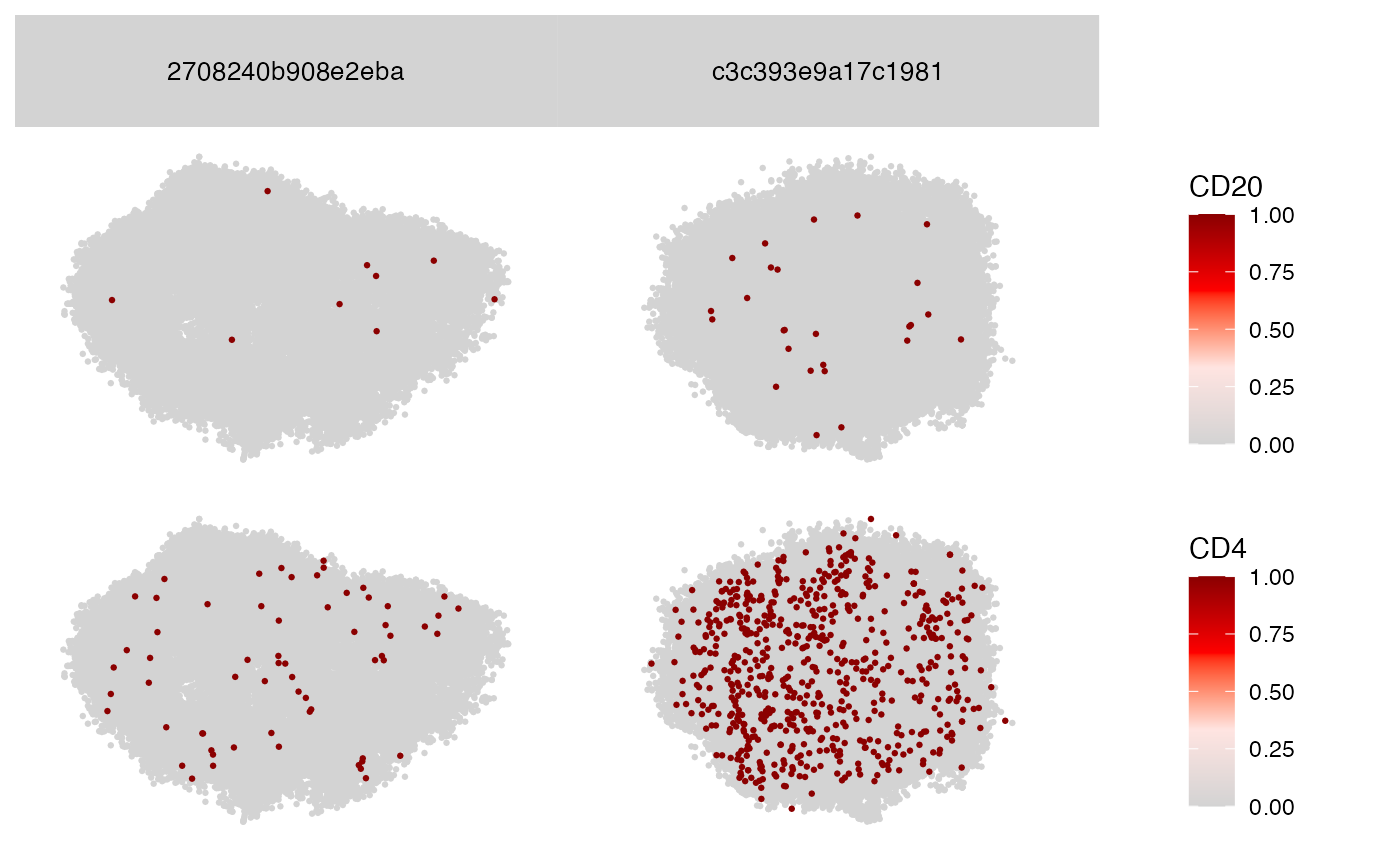
Plot2DGraphM(seur, cells = colnames(seur)[2:3], layout_method = "cpmds", markers = c("CD20", "CD4"))
#> ✖ 'CD20' is missing from node count matrix for component RCVCMP0000487
 # PNA
pxl_file <- minimal_pna_pxl_file()
seur <- ReadPNA_Seurat(pxl_file)
#> ✔ Created a <Seurat> object with 5 cells and 158 targeted surface proteins
seur <- LoadCellGraphs(seur, cells = colnames(seur)[2:3], add_layouts = TRUE)
#> ℹ Fetching edgelists for 2 cells
#> → Creating <CellGraph> objects
#> → Fetching marker counts
#> → Adding marker counts to <CellGraph> object(s)
#> → Fetching layouts
#> → Adding layouts to <CellGraph> object(s)
#> ✔ Successfully loaded 2 <CellGraph> object(s).
seur <- ComputeLayout(seur, layout_method = "cpmds", dim = 2)
#> ℹ Computing layouts for 2 graphs
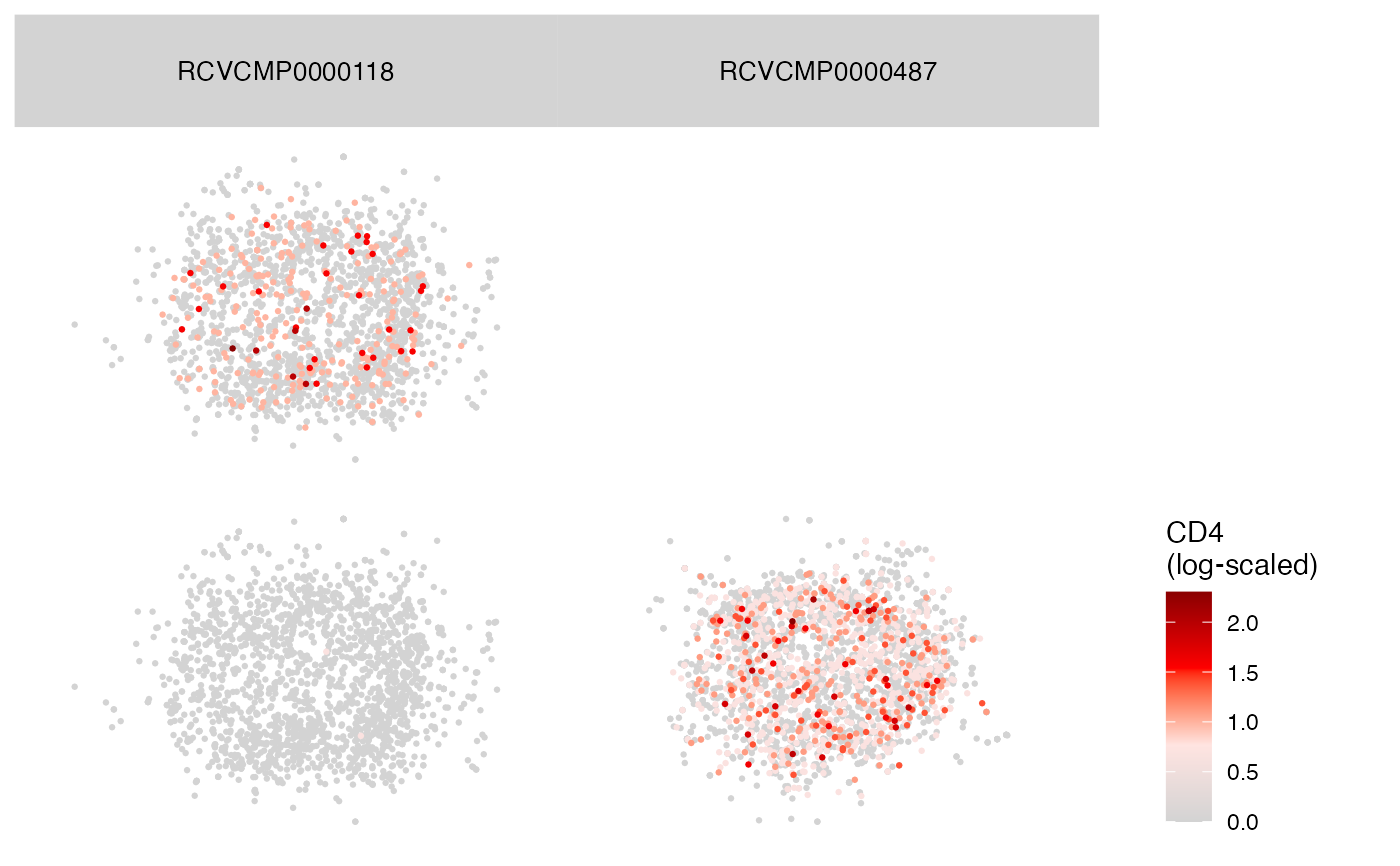
Plot2DGraphM(seur, cells = colnames(seur)[2:3], layout_method = "cpmds", markers = c("CD20", "CD4"))
# PNA
pxl_file <- minimal_pna_pxl_file()
seur <- ReadPNA_Seurat(pxl_file)
#> ✔ Created a <Seurat> object with 5 cells and 158 targeted surface proteins
seur <- LoadCellGraphs(seur, cells = colnames(seur)[2:3], add_layouts = TRUE)
#> ℹ Fetching edgelists for 2 cells
#> → Creating <CellGraph> objects
#> → Fetching marker counts
#> → Adding marker counts to <CellGraph> object(s)
#> → Fetching layouts
#> → Adding layouts to <CellGraph> object(s)
#> ✔ Successfully loaded 2 <CellGraph> object(s).
seur <- ComputeLayout(seur, layout_method = "cpmds", dim = 2)
#> ℹ Computing layouts for 2 graphs
Plot2DGraphM(seur, cells = colnames(seur)[2:3], layout_method = "cpmds", markers = c("CD20", "CD4"))