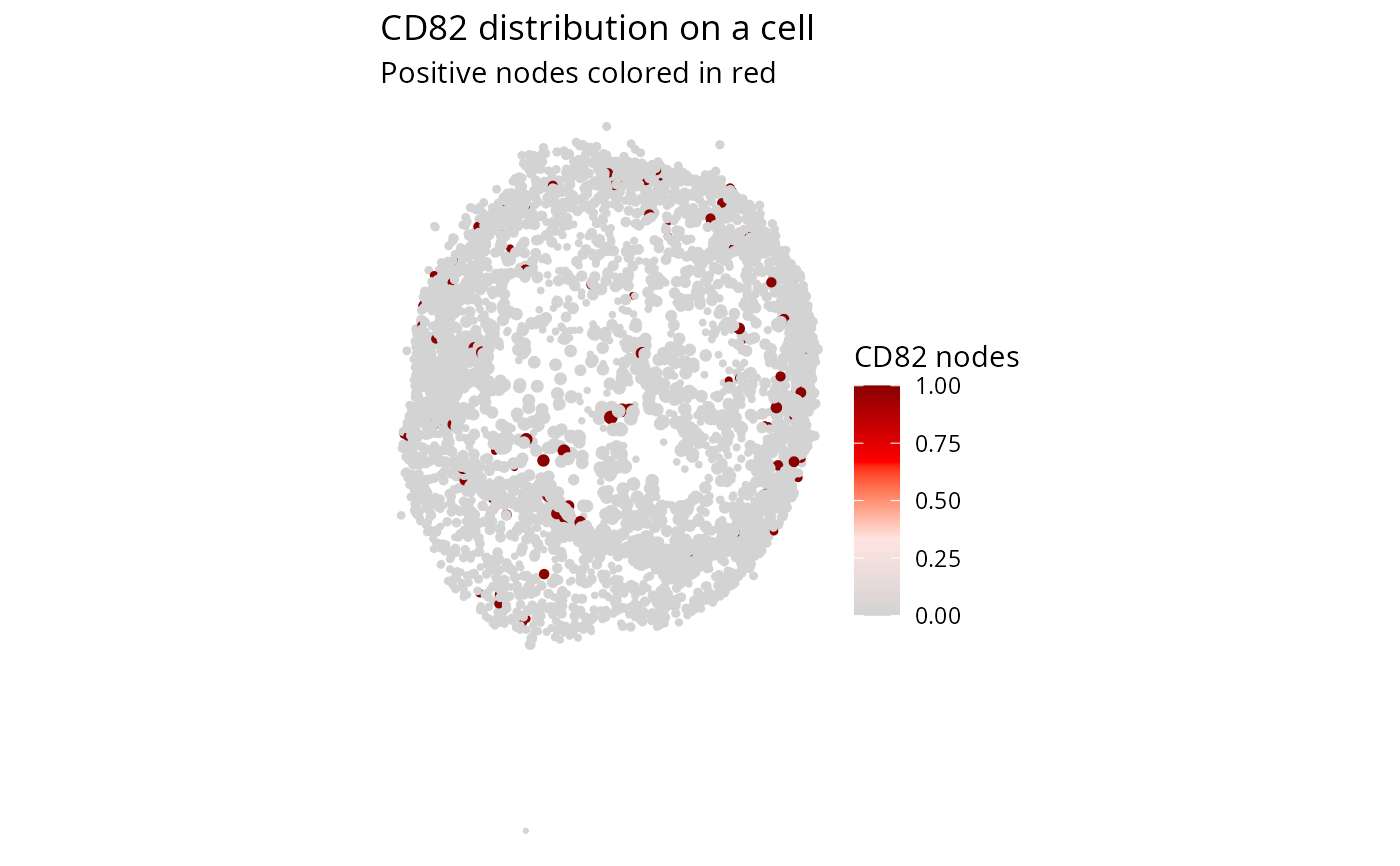
Annotate a cell plot
cell_annotation.RdSets title, subtitle, and color legend title text shared by cell plot
renderers. Annotation content is equivalent across backends, although
placement and typography may differ. When legend_title is omitted, the
mapped color column name is used.
See also
Other cell-plot-modifiers:
cell_grid(),
cell_illuminate(),
cell_node_depth(),
cell_node_scale_alpha(),
cell_node_scale_color(),
cell_node_scale_size(),
cell_theme()
Examples
se <- ReadPNA_Seurat(minimal_pna_pxl_file())
#> duckdb keeps downloaded extensions and secrets in a temporary directory:
#> ℹ /tmp/Rtmp3BjCtL/duckdb
#> This is removed when the R session ends.
#> • Extensions are re-downloaded each session.
#> • Secrets are lost.
#> ℹ Run duckdb(shared_home = TRUE) (or create ~/.duckdb) to keep them (suitable for most users).
#> ℹ Run duckdb(shared_home = FALSE) to accept the temporary directory (and silence this message).
#> ℹ See ?duckdb_storage for details and alternatives.
#> ✔ Created a <Seurat> object with 5 cells and 158 targeted surface proteins
se <- LoadCellGraphs(se, cells = colnames(se)[4], verbose = FALSE) |>
  ComputeLayout(layout_method = "spectral")
#> duckdb keeps downloaded extensions and secrets in a temporary directory:
#> ℹ /tmp/Rtmp3BjCtL/duckdb
#> This is removed when the R session ends.
#> • Extensions are re-downloaded each session.
#> • Secrets are lost.
#> ℹ Run duckdb(shared_home = TRUE) (or create ~/.duckdb) to keep them (suitable for most users).
#> ℹ Run duckdb(shared_home = FALSE) to accept the temporary directory (and silence this message).
#> ℹ See ?duckdb_storage for details and alternatives.
#> ℹ Computing layouts for 1 graphs

cell_graph <- CellGraphs(se)[[4]]

layout_data <- FetchLayoutData(cell_graph, vars = "CD82", layout_method = "spectral_3d") |>
  # Downsample to speed up tests
  dplyr::slice_sample(n = 5000)

cell_plot(layout_data, color = CD82) |>
  cell_annotation(
    title = "CD82 distribution on a cell",
    subtitle = "Positive nodes colored in red",
    legend_title = "CD82 nodes"
  )