
Set the cell plot node color scale
cell_node_scale_color.RdControls how a column mapped with cell_plot(color = ...) is represented.
Continuous versus categorical scales can be selected explicitly, or inferred
from the mapped column. Palette, limits, and missing-value color are recorded
here. Color scales are trained once across all panels, and continuous scales
span the observed range unless limits are supplied. A continuous scale is
therefore centered on zero only when limits are symmetric around zero, as
in limits = c(-2, 2). Palette and missing-value colors must be fully
opaque. Node opacity is controlled with cell_node_scale_alpha().
Usage
cell_node_scale_color(
  object,
  colors = NULL,
  limits = NULL,
  na_color = "grey50",
  type = c("auto", "continuous", "categorical")
)
Arguments
- object
A
cell_plotrecipe.- colors
Optional vector of valid, fully opaque colors used for the scale. When
NULL, the builder uses its default palette.- limits
Optional scale limits. Supply two ordered numeric values for a continuous scale or a character vector of levels for a categorical scale.
- na_color
Fully opaque color used for missing values.
- type
Scale type.
"auto"determines the type from the mapped column.
Details
This modifier requires a color mapping. One color shared by every point is
set with cell_plot(color = "red") instead.
See also
Other cell-plot-modifiers:
cell_annotation(),
cell_grid(),
cell_illuminate(),
cell_node_depth(),
cell_node_scale_alpha(),
cell_node_scale_size(),
cell_theme()
Examples
se <- ReadPNA_Seurat(minimal_pna_pxl_file())
#> ✔ Created a <Seurat> object with 5 cells and 158 targeted surface proteins
se <- LoadCellGraphs(se, cells = colnames(se)[4], verbose = FALSE) |>
ComputeLayout(layout_method = "spectral")
#> ℹ Computing layouts for 1 graphs
cell_graph <- CellGraphs(se)[[4]]
layout_data <- FetchLayoutData(cell_graph, vars = "CD82", layout_method = "spectral_3d") |>
# Downsample to speed up tests
dplyr::slice_sample(n = 5000)
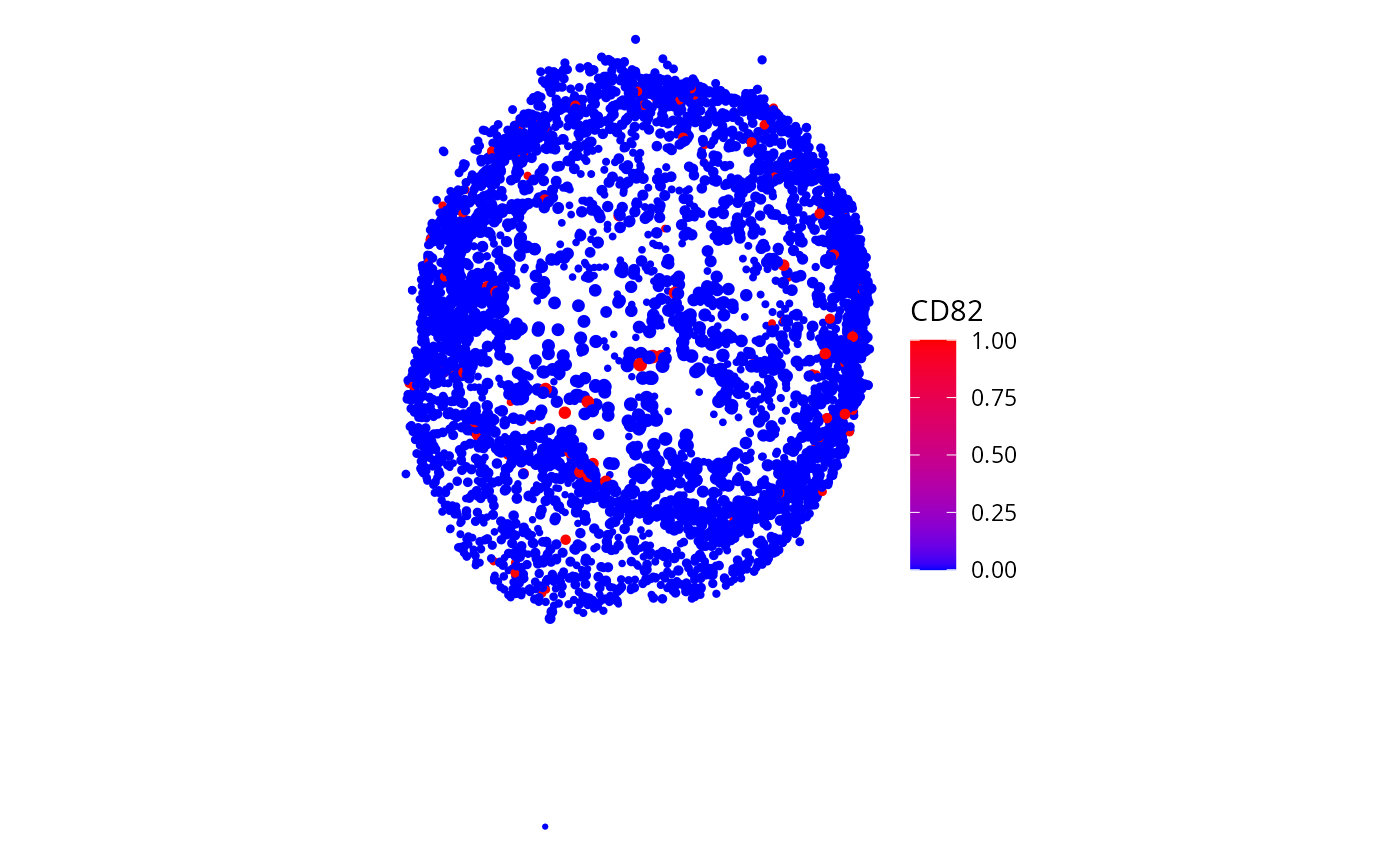
cell_plot(layout_data, color = CD82) |>
cell_node_scale_color(colors = c("blue", "red"))
 # One color for every point
cell_plot(layout_data, color = "red")
# One color for every point
cell_plot(layout_data, color = "red")