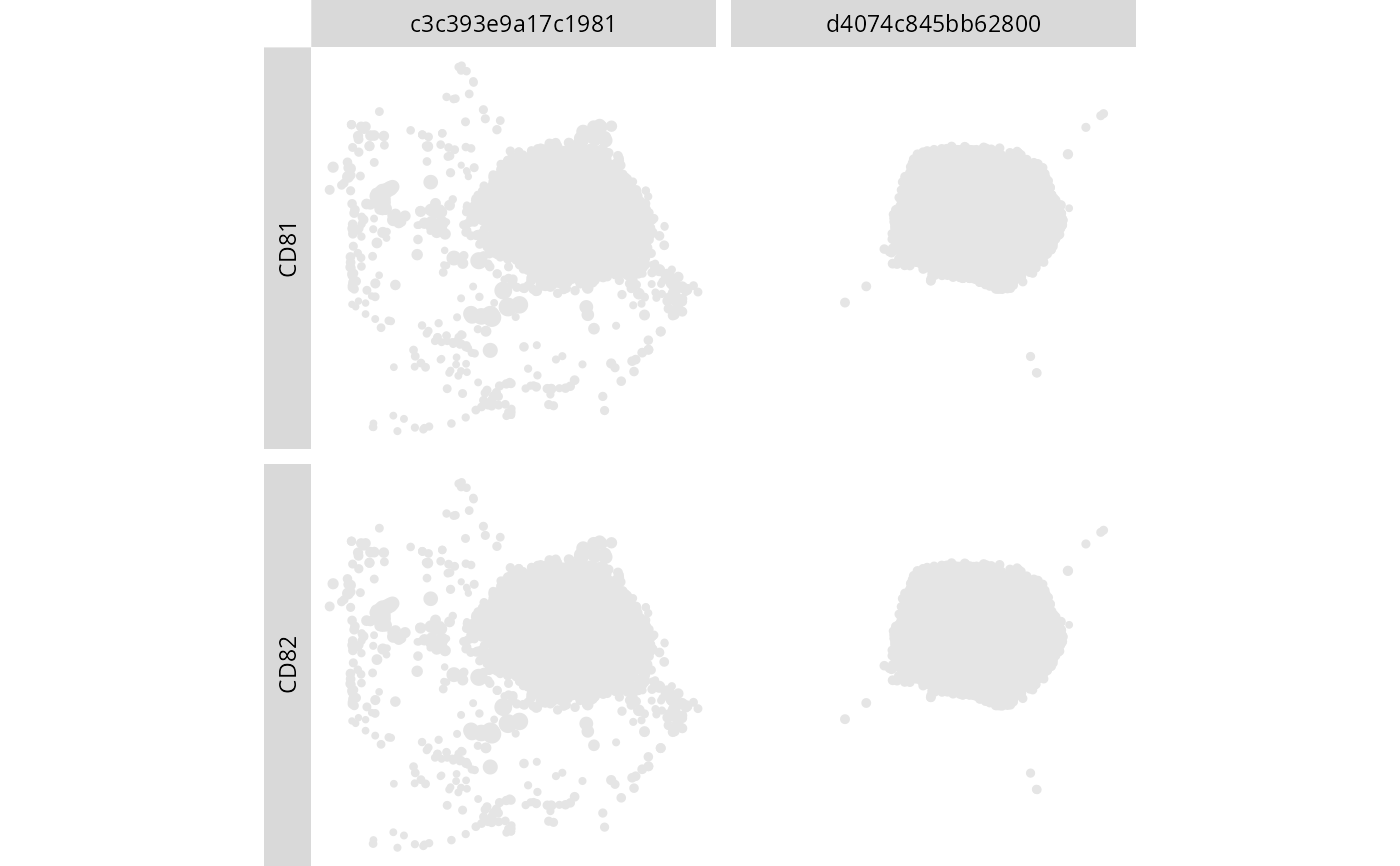
Arrange a cell plot in a panel grid
cell_grid.RdDefines panel rows and columns using existing categorical columns. Named arguments are preferred because they make grid orientation explicit. Facet values may be character, factor, or integer columns. This modifier records mappings only and does not reshape the plot data.
See also
Other cell-plot-modifiers:
cell_annotation(),
cell_illuminate(),
cell_node_depth(),
cell_node_scale_alpha(),
cell_node_scale_color(),
cell_node_scale_size(),
cell_theme()
Examples
library(dplyr)
se <- ReadPNA_Seurat(minimal_pna_pxl_file())
#> duckdb keeps downloaded extensions and secrets in a temporary directory:
#> ℹ /tmp/Rtmp3BjCtL/duckdb
#> This is removed when the R session ends.
#> • Extensions are re-downloaded each session.
#> • Secrets are lost.
#> ℹ Run duckdb(shared_home = TRUE) (or create ~/.duckdb) to keep them (suitable for most users).
#> ℹ Run duckdb(shared_home = FALSE) to accept the temporary directory (and silence this message).
#> ℹ See ?duckdb_storage for details and alternatives.
#> ✔ Created a <Seurat> object with 5 cells and 158 targeted surface proteins
se <- LoadCellGraphs(se, cells = colnames(se)[3:4], verbose = FALSE) |>
  ComputeLayout(layout_method = "cpmds")
#> duckdb keeps downloaded extensions and secrets in a temporary directory:
#> ℹ /tmp/Rtmp3BjCtL/duckdb
#> This is removed when the R session ends.
#> • Extensions are re-downloaded each session.
#> • Secrets are lost.
#> ℹ Run duckdb(shared_home = TRUE) (or create ~/.duckdb) to keep them (suitable for most users).
#> ℹ Run duckdb(shared_home = FALSE) to accept the temporary directory (and silence this message).
#> ℹ See ?duckdb_storage for details and alternatives.
#> ℹ Computing layouts for 2 graphs
layout_data <- FetchLayoutData(se, vars = c("CD81", "CD82"), layout_method = "cpmds_3d") |>
  # Downsample to speed up tests
  group_by(component) |>
  slice_sample(n = 5000) |>
  tidyr::pivot_longer(cols = c("CD81", "CD82"), names_to = "marker", values_to = "value")


cell_plot(layout_data) |>
  cell_grid(rows = marker, cols = component)